
Intraday trading is a type of trading where traders buy and sell securities within the same day. Intraday traders need to make quick decisions to grab a profitable trade with the help of intraday trading indicators. And, for that, they use the Best indicators for intraday trading in trading view to accurately predict price movements.
There are many intraday trading indicators that can be used for intraday trading, however, with our practical experience, we have selected some of the best indicators for intraday trading in TradingView free. You can give them a try initially for the experimental purpose and then choose the most relevant and suitable as per your trading style and time frame.
“always trade with the trend, never go against the trend”
Here are 7 of the best free indicators for intraday trading on TradingView, along with how to use them:
Best Indicators for Intraday Trading in TradingView Free
1. Moving Averages
Moving averages are one of the Best indicators for intraday trading in tradingView free. You can use them to identify trends, support and resistance levels, and entry and exit points. This indicator calculates the average price of a security over a period of time.
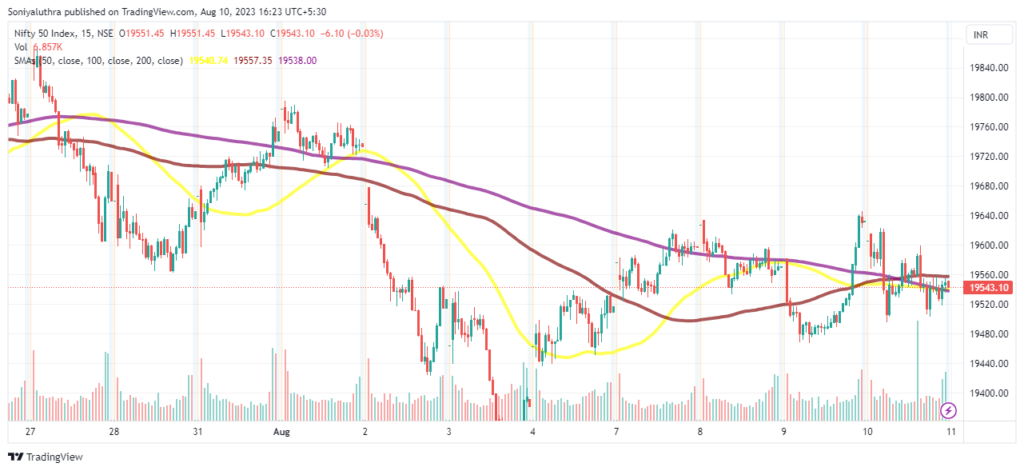
Moving average trading indicators are of different types. The most important are as follows:
- Simple moving average (SMA) – It is calculated by adding up the closing prices of a security over a specified period of time and then dividing by the number of periods.
- Exponential moving average (EMA) – The EMA gives more weightage to recent price data, which makes it more responsive to changes in price.
- Weighted moving average (WMA) – The WMA gives more weightage to larger price movements. This makes it more sensitive to changes in trends.
Settings for Moving averages
Period: For intraday trading, you can choose a short-term moving average like the 5-minute or 15-minute SMA. And, Use a 200-day SMA for the confirmation of the overall Trend.
MA Type: Choose among SMA, EMA, and WMA depending upon your trading style. For example, if you are trading short-term trends, you may use an EMA. If you are trading longer-term trends, you may use a WMA.
How to trade with Moving averages?
Use moving averages trading indicators to identify trends, support, and resistance levels and generate trading signals when they cross each other. You can also invert chart in TradingView to apply indicators with more ease.
2. Bollinger Bands
Bollinger Bands are another Best indicators for Intraday Trading in tradingView free. You can use Bollinger bands to measure volatility and identify overbought and oversold conditions.
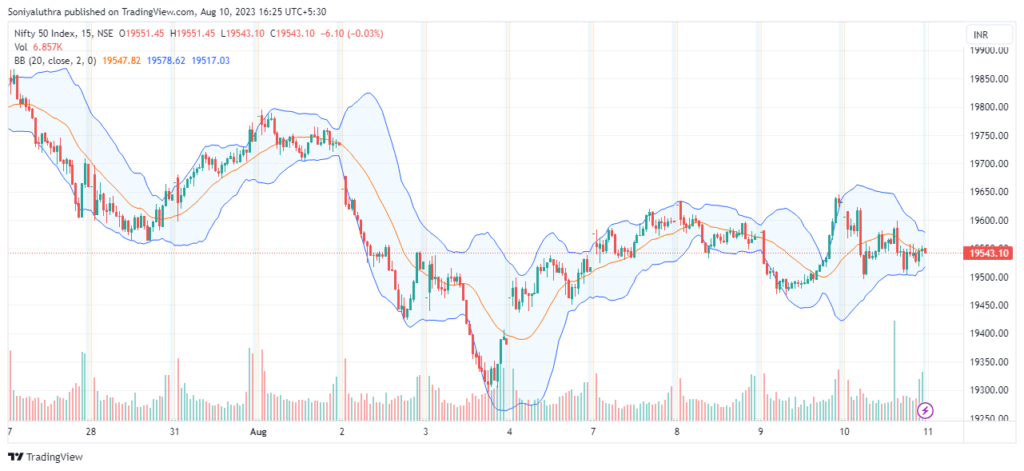
When the price moves above the top band, it is called overbought. When the price moves below the bottom band, it is called oversold.
Settings for Bollinger Bands
Bollinger Bands consist of three lines: a middle line, a top line, and a bottom line. The middle line is a simple moving average of the price. The top line is the middle line plus two standard deviations, and the bottom line is the middle line minus two standard deviations.
- Period: 20
- Standard Deviation: 2
- Moving Average Type: Simple Moving Average (SMA)
How to trade with Bollinger Bands?
You can use Bollinger Bands to identify entry and exit points and identify overbought and oversold conditions.
Start your Trading journey today with Candlestick Patterns
3. Moving Average Convergence Divergence (MACD)
The Moving Average Convergence Divergence (MACD) is a trend-following indicator. You can use MACD to identify changes in momentum.
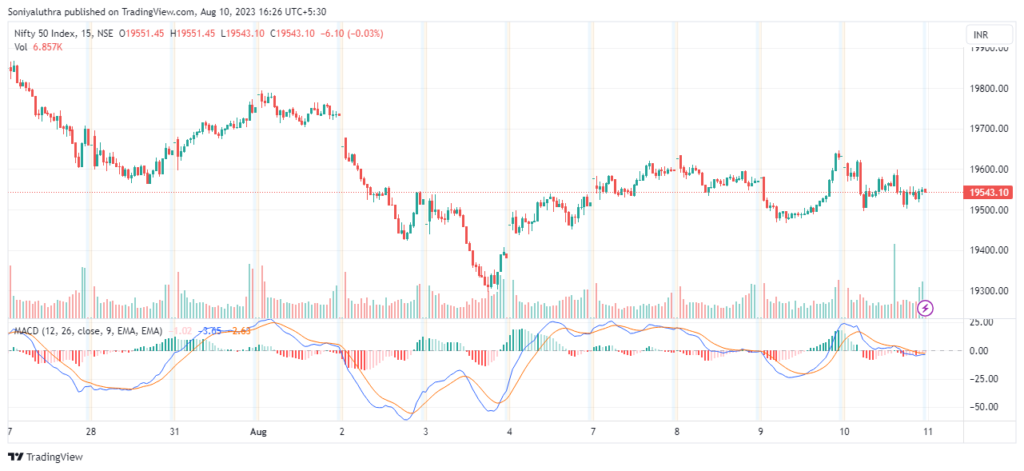
Settings for MACD
The MACD is calculated by subtracting a longer moving average from a shorter moving average. The difference is then shown on a chart.
- Fast EMA Period: 12
- Slow EMA Period: 26
- Signal EMA Period: 9
- MACD Line Color: Blue
- Signal Line Colour: Red
When the MACD line crosses above the signal line, then it shows a bullish signal. This means that the momentum is positive and prices are likely to continue rising. On the other hand, when the MACD line crosses below the signal line, then it indicates a bearish signal. This means that the momentum is negative and prices are likely to continue falling.
How do trade with MACD?
You can use the MACD to identify entry and exit points and confirm trends.
4. Relative Strength Index (RSI)
The Relative Strength Index (RSI) is a momentum indicator to measure the speed and magnitude of price changes. A trader can use RSI to identify overbought and oversold conditions.
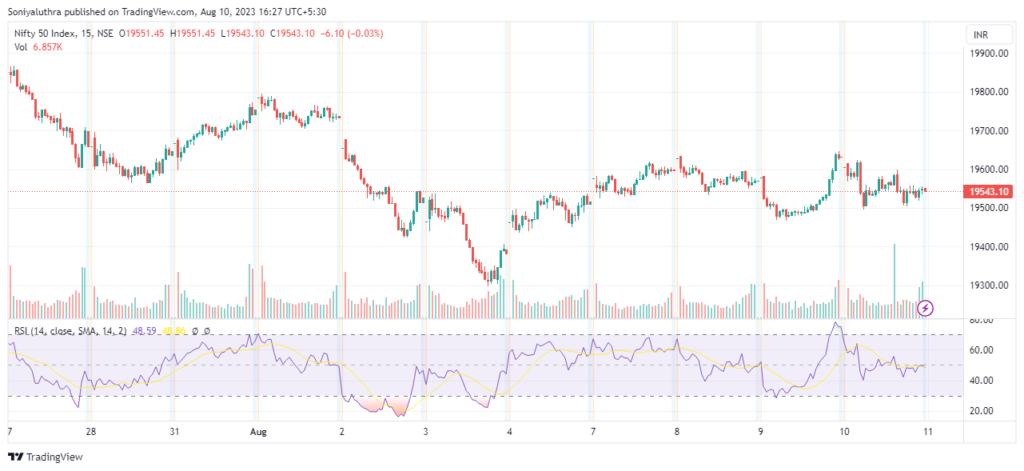
Settings for RSI
- Period: 14 (default)
- Overbought Level: 70
- Oversold Level: 30
- Smoothing: None or with a short-period SMA
The RSI is calculated by dividing the average of the up closes over a certain period by the average of the down closes over the same period. And, then the number is plotted on a scale of 0 to 100.
An RSI of 70 or above is considered to be overbought, while an RSI of 30 or below is considered to be oversold. When the RSI moves above 70, it is a signal that the market is overbought and may be due for a correction. When the RSI moves below 30, it is a signal that the market is oversold and may be due for a rally.
How to trade with RSI?
You can use the RSI to identify entry and exit points by looking for breakouts and breakdowns of the 70 and 30 levels. You can also use it to identify overbought and oversold conditions, which can help you to avoid losing money on losing trades.
5. Stochastic Oscillator
The Stochastic Oscillator is a momentum indicator that is used to identify overbought and oversold conditions. You can use it to identify entry and exit points and also to confirm trends.
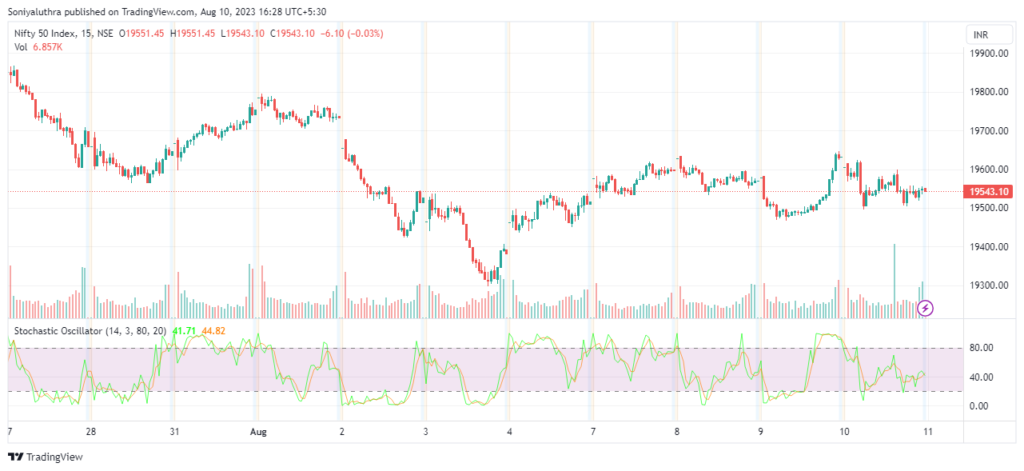
Settings for Stochastic Oscillator
The Stochastic Oscillator is calculated by dividing the closing price of a security by its price range over a certain period. The resulting value is then plotted on a scale of 0 to 100.
A stochastic oscillator of 80 or above is considered to be overbought, while a stochastic oscillator of 20 or below is considered to be oversold. When the stochastic oscillator moves above 80, it is a signal that the market is overbought and may be due for a correction. When the stochastic oscillator moves below 20, it is a signal that the market
How to trade with Stochastic Oscillator?
- %K Period: 14
- %D Period: 3
- Slowing: 3
- Overbought Level: 80
- Oversold Level: 20
The Stochastic Oscillator can be used to identify entry and exit points for trades. When the Stochastic Oscillator moves below 20, it gives a buy signal, and the price starts to rise. When the Stochastic Oscillator moves above 80, it gives a sell signal and the price starts to fall.
The Stochastic Oscillator can also be used to set stop losses. A stop loss can be placed below the 20 level when the Stochastic Oscillator is oversold and above the 80 level when the Stochastic Oscillator is overbought.
Bonus Best indicator for intraday trading in tradingview free
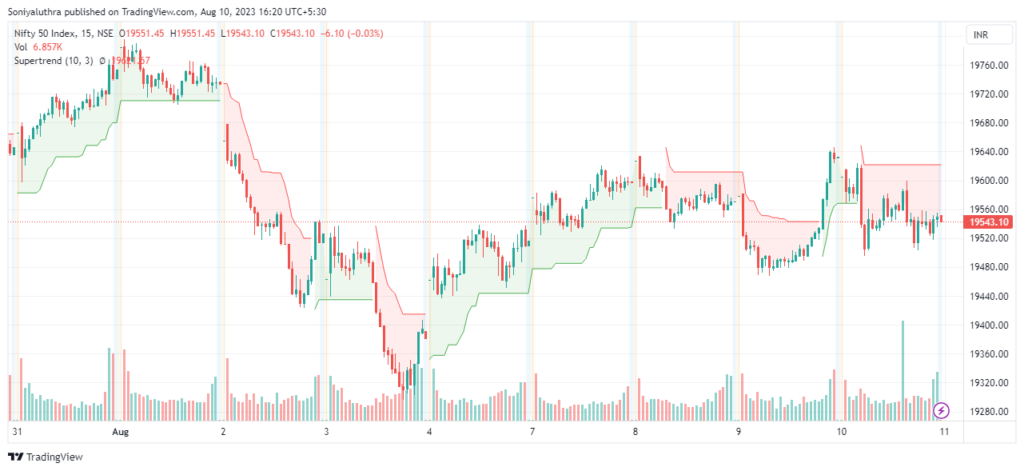
Supertrend
The Supertrend indicator is a trend-following indicator. It is useful in identifying trends and trading with them. The indicator is very effective in trending markets.
Settings for supertrend
The Supertrend indicator is calculated by using the Average True Range (ATR) and a multiplier. The default settings for the Supertrend indicator are 10 for the ATR and 3 for the multiplier.
How to trade with supertrend?
- ATR Period: 10
- ATR Multiplier: 3
The Supertrend indicator is plotted as a line on a chart. The line moves up and down with the price, and it changes colour depending on whether the trend is bullish or bearish.
When the Supertrend indicator is green, it is a signal that the trend is bullish and that prices are likely to continue rising. When the Supertrend indicator is red, it is a signal that the trend is bearish and that prices are likely to continue falling.
The Supertrend indicator can be used to identify entry and exit points for trades. A buy signal is generated when the price breaks above the Supertrend line and the Supertrend indicator turns green. A sell signal is generated when the price breaks below the Supertrend line and the Supertrend indicator turns red.
It is a good choice for traders who are looking for a simple and effective way to trade with trends.
Conclusion
In conclusion, 5 Best indicators for intraday trading in tradingView free offer valuable insights for intraday traders seeking to profit from short-term price movements.
You can master in above Best indicators for intraday trading in tradingView free to enhance your trading skills and decision-making power.
However, make sure to combine technical indicators with solid risk management strategies is key to achieving consistent profitability.
Frequently asked questions
1. What is the best indicator for intraday trading in TradingView?
The best indicator for intraday trading in TradingView is the Bollinger Bands indicator. It is a highly volatility indicator that can be used to identify overbought and oversold conditions. You can also use them to set stop losses.
2. What are the top 5 indicators in TradingView?
The top 5 indicators for intraday trading in TradingView are:
Bollinger Bands
RSI
Stochastic Oscillator
Moving Averages
Volume Profile
These indicators are popular because they are relatively easy to use and can be effective in identifying trends, support and resistance levels, and overbought and oversold conditions.
3. Which indicator shows buy and sell TradingView?
There are many indicators that can be used to show buy and sell signals in TradingView. Some of the most popular indicators for this purpose include:
Bollinger Bands (free indicator)
RSI (free indicator)
Stochastic Oscillator (free indicator)
Moving Averages (free indicator)
Volume Profile (paid indicator)
4. What is the best indicator for the 5 minute chart in TradingView?
The best indicators for the 5 minute chart in TradingView will depend on the security being traded and the trader's preferences. However, some of the most popular indicators for the 5 minute chart include:
Bollinger Bands
RSI
Stochastic Oscillator
Moving Averages
Volume Profile