

Invert chart in Tradingview means flips the price scale, showing prices increasing from top to bottom.
Key Takeaways:
Methods to Invert:
1. Keyboard shortcut:
Windows: Alt + I
Mac: ⌥ (Option) + I
2. Chart settings menu: Click the gear icon in the bottom right corner and select “Invert scale.”
3. Mobile app:
- Tap the gear icon and choose “Invert scale.”
- To revert to the standard view, use the same methods.
How to Invert chart in TradingView – Explained with Example
How to Invert Tradingview Chart Using the Keyboard Shortcut (Windows and Mac)
Method 1: Keyboard Shortcut
For Windows: Press Alt + I
For Mac: Press ⌥ (Option) + I
This is the quickest way to invert the chart.
Also Check: 5 Best Indicators for Intraday Trading in TradingView Free
How to Invert Chart on TradingView Through Chart Setting (Mac & Windows)
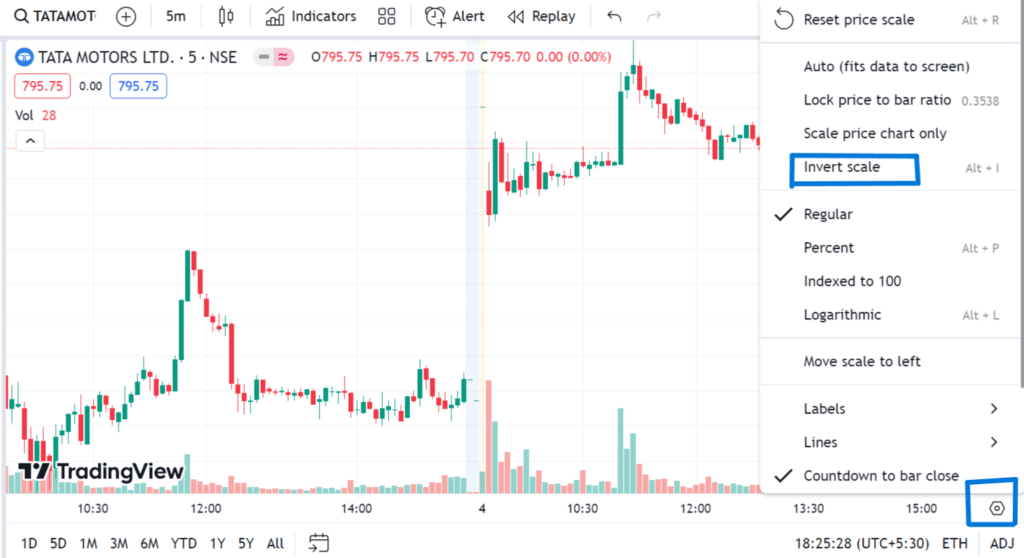
Method 2: Chart Settings Menu
- Click the gear icon in the bottom right corner of the chart.
- A menu will open; select “Invert scale” from the menu, and your vertical scale will invert.
If you want to revert to the original scale, simply click again on the “gear icon,” and the same menu will open. Deselect the tick of the Invert Scale.
Access Your Ready Starter for Trading: 35 Powerful Candlestick Patterns
How to Invert Chart in Tradingview Mobile App (Android and iPhone)
Method 3: Mobile App
- Tap the gear icon in the bottom right corner of the chart.
- Select “Invert scale” from the settings menu.
How to Rotate Chart in Tradingview?
While TradingView doesn’t offer a feature to physically rotate the chart, you can invert or flip its price scale to achieve a similar visual representation. You can use any of the above 3 methods to rotate chart in Tradingview.
Why Invert a Chart Scale?
Once you invert chart in Tradingview, the price scale will be flipped, with prices increasing from top to bottom instead of bottom to top. This can be helpful for:
Identifying support and resistance levels: Viewing the chart from a different perspective can sometimes reveal patterns that weren’t immediately apparent in the standard view.
Analyzing inverse relationships: If you’re looking at assets that tend to move in opposite directions (e.g., gold and the US dollar), inverting one of the charts can help you visualize their correlation more easily.
Spotting potential trend reversals: Some traders believe that seeing an inverted chart can help them anticipate when a trend might be starting to change direction.