What are Candlesticks?
Candlestick charts are a type of chart that uses candles to track the price movements of a security over time. Each candle represents a single trading period, and the length of the candle indicates the range of prices traded during that period.
35 Powerful Candlestick Patterns Overview
| File Information | Details |
| File Name | 35 Powerful Candlestick Patterns Book |
| Book Quality | Very Good |
| No. of Pages | 73 |
| Category | Technical Analysis |
What Will You Get In This 35 Powerful Candlestick Patterns?
In this 35 Powerful Candlestick Patterns book, you will get detailed explanations of 35 different candlestick patterns. The book covers bullish, bearish, and sideways patterns. You will also get the real world market examples of each pattern.
Additionally the book contains various trading trips for each pattern along with how to use 35 powerful candlestick patterns in conjunction with other technical analysis tools.
The 35 Powerful Candlestick Patterns book is a must have book for every trader who wants to be successful in their trading career.
benefits of using candlestick patterns for trading
- Candlestick patterns can help you to identify the trends reversals, continuations, supports, and resistances.
- Candlestick patterns can help you to understand the market sentiments and traders psychology.
- Candlestick patterns can help you to identify overbought and oversold markets.
- Candlestick patterns can help you to set stop losses and profit targets.
Traders !! If you’re not using candlestick patterns for trading, I highly recommend you check out the 35 Powerful Candlestick Patterns book. It’s truly Amazing !! You will be confident how to use this powerful technical analysis tool to improve your trading results.
35 Powerful Candlestick Patterns
Get all Free Trading Resources
How to trade with 35 powerful candlestick patterns?
Candlestick patterns are one of the most powerful tools that traders can use to analyze the market. It helps them to make informed trading decisions and become a successful trader.
One you understand the different candlestick patterns, you can easily identify potential reversals, continuations, and breakouts.
Let’s understand candlestick patterns:
Bullish Candlestick Patterns
Hammer
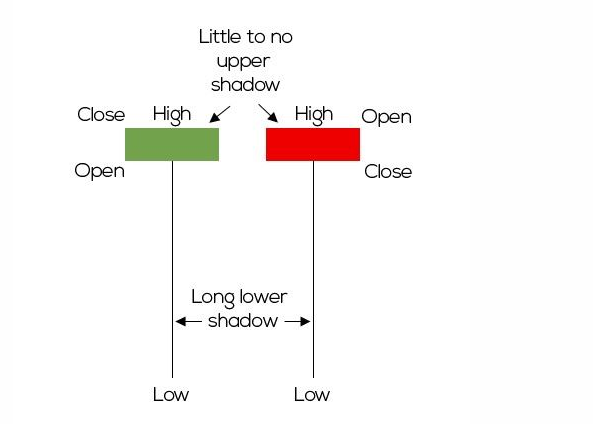
- The hammer is a bullish candlestick pattern that indicates a potential reversal from a downtrend.
- It is formed when the open, close, and low prices are all relatively close together, but the high price is significantly higher.
- This indicates that there was strong buying pressure at the end of the day, that can convert bearish market to a bullish market. Hence, Hammer is a trend reversal candlestick.
Also Read : How To Make Money Trading With Candlestick Charts? (Free)
Bullish Engulfing
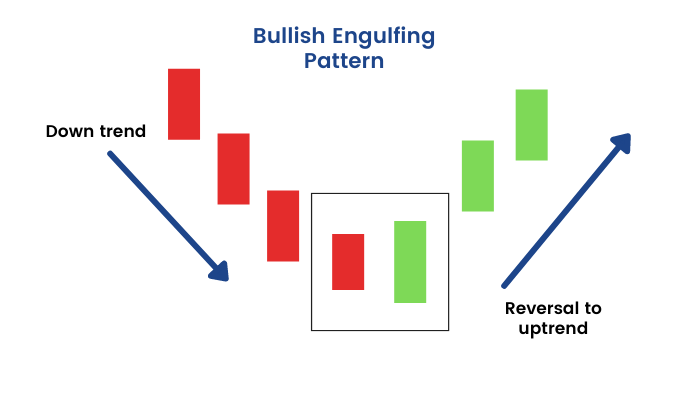
- The bullish is formed when a small bearish candle is followed by a larger bullish candle that completely covers the previous candle.
- This covering indicates that there was a strong shift in sentiment from bearish to bullish. It could bring a a significant price rally towards bullish trend.
Morning Star
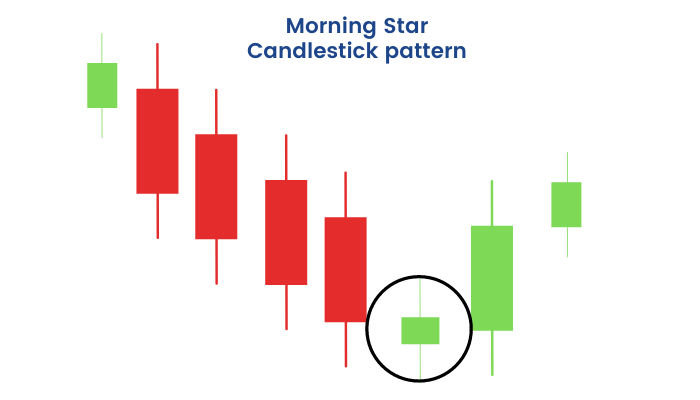
- The morning star is a bullish three-candlestick pattern that signals a potential reversal from a downtrend.
- The first candle is a long bearish candle, followed by a small doji or spinning top candle, and then a large bullish candle.
- The long bearish candle indicates that the bears are in control, but the small doji or spinning top candle indicates that there is indecision in the market.
- The large bullish candle then confirms that the bulls have taken control and that a bullish reversal is underway.
Bearish Candlestick Patterns
Shooting Star
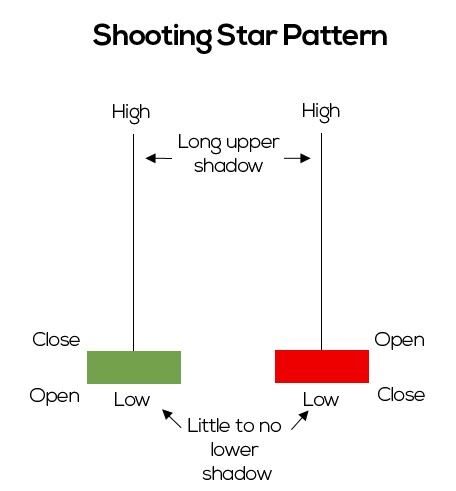
- The shooting star is a bearish candlestick pattern that indicates a potential reversal from an uptrend.
- It is formed when the open, close, and high prices are all relatively close together, but the low price is significantly lower.
- This indicates that there was strong selling pressure at the end of the day, that can covert bearish market to bullish market.
Read More: Shooting Star Candlestick Pattern – 1 Pattern, 3 Secrets to Find and Use
Bearish Engulfing
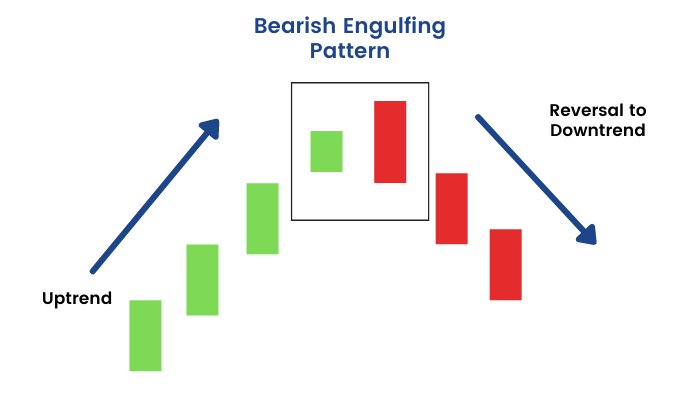
- The bearish engulfing pattern is formed when a small bullish candle is followed by a larger bearish candle that completely covers the previous candle.
- This indicates that there was a strong shift in sentiment from bullish to bearish, that can lead to a significant price decline.
Evening Star
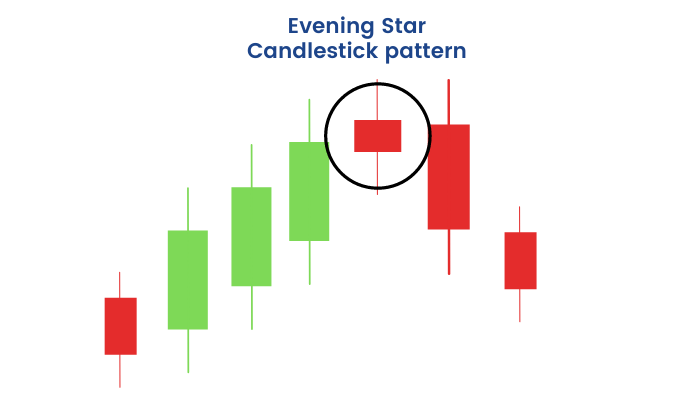
- The evening star is a bearish three-candlestick pattern that signals a potential reversal from an uptrend.
- The first candle is a long bullish candle, followed by a small doji or spinning top candle, and then a large bearish candle.
- The long bullish candle indicates that the bulls are in control, but the small doji or spinning top candle indicates that there is indecision in the market.
- The large bearish candle then confirms that the bears have taken control and that a bearish reversal is underway.
So, these are just a small sample among the 35 powerful candlestick patterns that traders can use to analyze the market. Learning these patterns will give you confidence to identify the potential opportunities in the market and earn a good profit.
Get the 35 Powerful Candlestick Patterns Book today and start using these powerful tools to improve your trading results!
35 Powerful Candlestick Patterns
Images credit to respective owner
Want to start trading and be a successful trader? Get my complete guidance How To Do Intraday Trading in India For Beginners 2023 | Free Resources

