
Candlestick charts are one of the most popular tools used by traders to analyze the market and make trading decisions. These charts use candles to represent the price action of a security. In this guide, we will talk about “How To Make Money Trading With Candlestick Charts?”
You will learn how to identify the different patterns, how to interpret the psychology of the market, and how to use candlestick charts in conjunction with other technical analysis tools.
Candlestick Basics:
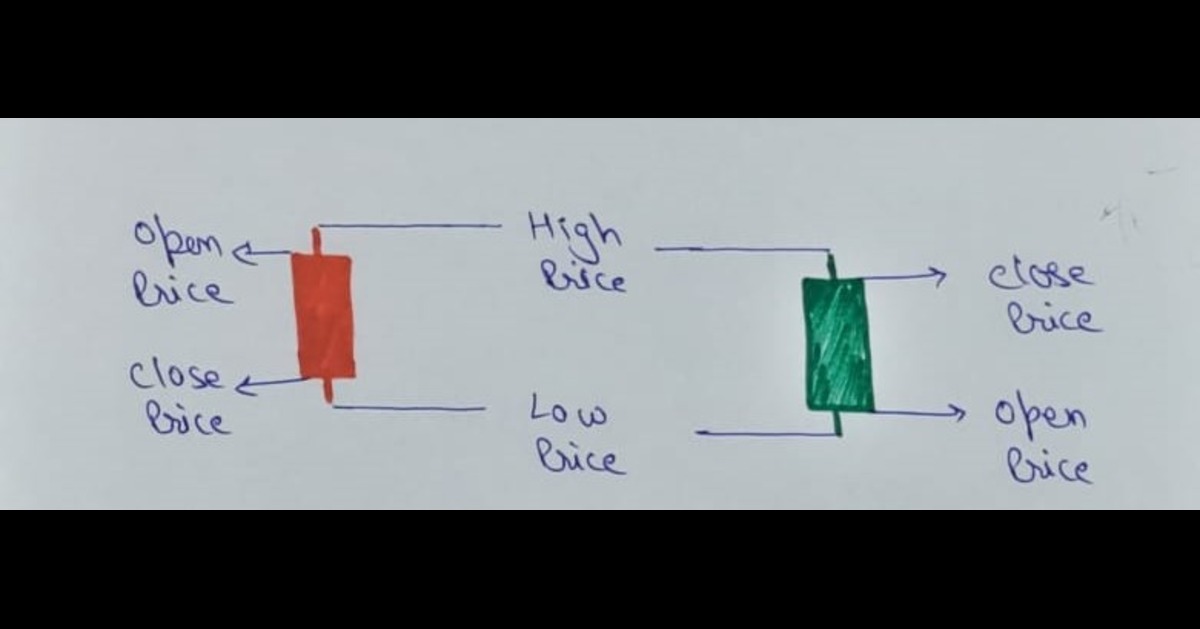
- Explains what candlestick charts are and their components (body, wick/shadow, open/close/high/low prices).
- Describes how the color (green/red) and size of the body indicate price movement and trader sentiment.
- Illustrates how wicks represent the highest and lowest traded prices within the timeframe.
Understanding Market Psychology:
- Explains how different timeframes can affect candle formation and how emotions influence trading decisions.
- Discusses how to analyze candlesticks to understand buyer and seller behavior.
- Emphasizes the importance of letting candles fully form before making trading decisions to avoid confusion.
Trading with Candlestick Patterns:
- Introduces various candlestick patterns like bullish/bearish engulfing, hammer, hanging man, doji, and shooting star.
- Explains how these patterns signal potential trend reversals, continuations, and entry/exit points.
- Covers strategies for both trend-following and reversal trading based on candlestick patterns.
Using Candlesticks with Other Tools:
- Advocates for combining candlestick analysis with other technical indicators like moving averages and oscillators for better accuracy.
- Encourages practice and continuous learning to master candlestick trading.
Candlestick charts are a type of chart that uses candles to track the price movements of a security over time. Each candle represents a single trading period, and the length of the candle indicates the range of prices traded during that period. The color (green or red) of the candle indicates whether the price closed higher or lower than it opened.
Also Check: Shooting Star Candlestick Pattern – 1 Pattern, 3 Secrets to Find and Use
A candle is made up of six key components that represent different types of information:
- Body,
- Wick/shadow,
- Opening price,
- Closing price,
- High price, and
- Low price.
What is the body and wick/shadow of a candle in the stock market?
Body: The body of a candlestick represents the difference between the opening and closing prices of a given time, whether it’s a minute, an hour, a day, or any other chosen time interval. A longer body signifies a more significant price change, while a shorter body indicates a relatively smaller price change.
Body can be of two colors: Green and Red
- Green body candle: If the closing price is higher than the opening price, the body of the candle is green.
- Red body candle: If the closing price is lower than the opening price, the body of the candle is red.
Wick/shadow: The wick, also known as the shadow, extends from the top and/or bottom of the body of the candle. The wicks of the candle represent the high and low prices for the day.
Meaning of different prices of a candle in the stock market
Opening price of a candle: The opening price is the price at which a security first trades on a given day.
Closing price of a candle: The closing price is the price at which security last trades on a given day.
High price of a candle: The high price is the highest price that a security traded at on a given day.
Low price of a candle: The low price is the lowest price that security is traded at on a given day.
Example of Candlestick Chart
Here is an example of a candlestick chart of Tata Motors Ltd. with reference to the How to Make Money Trading With Candlestick Charts.
Info view in Zerodha Kite platform

Open: 616.21
High: 616.53
Low: 613.79
Close: 614.10
Explanation: The red body (we have selected) of the candle tells us that the Tata motors share opened at 616.21, closed at 614.10, and traded between 613.79 and 616.53 during the day. The wicks tell us that the Tata motors share traded as high as 616.53 and as low as 613.79 during the day.
Table view in Zerodha Kite platform

How Candles Represent the Emotions of Traders?
You can analyze the market in different time frames, such as starting from 1 min up to 4 hours, 1 day, 1 week to 1 month, depending upon the type of trade you want to execute.
Depending upon the time frame, the body changes many times from green to red and red to green. If you select 5 min time frame chart, you will see even a single 5 min candle move up and down, i.e., red to green and vice versa. Many times which creates confusion about whether you should take the trade or not. How to Make Money Trading With Candlestick Charts.
How the market play with our emotions – The psychology of candlestick charts
You are observing that a candle is forming, which is forming as green, and you take trade (Happy emotions 🤑😁.) But in the next few seconds, the candle starts moving in the opposite direction and it starts becoming red (fear or sad emotions 😰😓) Your emotions changed from happiness to fear.
Right?
And that’s how the emotions of a trader change from time to time. However, you can use candlestick charts to understand the psychology of traders. For example, a long-legged Doji is a candlestick pattern that occurs when the opening and closing prices are very close together. This pattern often signals that traders are not able to decide the direction of the market. How to Make Money Trading With Candlestick Charts.
So, how to avoid such trapping confusion?
Let the candle build properly and then analyze, no matter whatever time frame you are choosing because every minute’s emotions change. So, it will create confusion. You need to analyze the buyer’s and seller’s behavior through candlesticks.
Firstly, fix your time frame and then take action after building a proper candle. Your trading action should not be on the candle that is in progress but should be based on the candle that is properly built.
How to use candlestick charts in your trading?
If you want to use candlestick charts to make money, it is important to learn about the different types of candlestick chart patterns and how to interpret the psychology of the market.
Most importantly, the candlestick charts must be used in conjunction with other technical analysis tools to make more informed trading decisions.
How candlestick charts can be used to make money?
Candlestick charts can be used to make money by identifying patterns that can help traders make profitable trades. How to Make Money Trading With Candlestick Charts; There are many different candlestick patterns, but some of the most common and reliable patterns include:
- Bullish engulfing pattern
- Bearish engulfing pattern
- Hammer
- Hanging man
- Shooting star
- Doji
In addition to identifying patterns, candlestick charts can also be used to understand the psychology of traders.
How To Make Money Trading With Candlestick Charts?
What you will learn in How To Make Money Trading With Candlestick Charts?
The book “How To Make Money Trading With Candlestick Charts” provides a comprehensive guide on how to use candlestick chart patterns to become a profitable trader. It explains key concepts such as candlestick formation, patterns, and their interpretation.
How To Make Money Trading With Candlestick Charts?
Book owner and credit to Balkrishna M. Sadekar
The book emphasizes the power of candlestick patterns in identifying potential trend reversals, continuations, and entry/exit points. It covers various powerful patterns, including Doji, Hammer, Engulfing, and more, along with their implications for trading strategies.
The strategies discussed in the book encompass both trend-following and reversal techniques, illustrating how traders can leverage candlestick patterns to predict price movements and make informed decisions. Importantly, the book advocates for combining candlestick analysis with other technical indicators to enhance the accuracy of trading signals.
The book highlights the need for practice and continuous learning to master candlestick trading and How To Make Money Trading With Candlestick Charts.
In essence, “How To Make Money Trading With Candlestick Charts” serves as a comprehensive roadmap for traders seeking to harness the power of candlestick patterns to improve their trading success and generate profits in the dynamic world of financial markets.
How to Make Money Trading with Candlestick Charts Paperback
Get All Free Trading Resources
Conclusion
Candlestick charts are a powerful tool for technical analysis. By understanding the different parts of a candlestick and the patterns that can form, you can achieve your goal of “How To Make Money Trading With Candlestick Charts.”
However, it is important to learn how to use them correctly and to avoid common mistakes. If you are serious about trading, then you should consider learning How To Make Money Trading With Candlestick Charts.
Disclaimer: The information provided on this website is for educational and informational purposes only. Visitors and users of this website are solely responsible for their own decisions and actions based on the information provided here.
Disclaimer: The information provided on this website is for general informational purposes only and should not be construed as financial advice, investment recommendations, or guarantees of any kind. This information is not intended as a substitute for professional financial advice. You should always seek the advice of a qualified financial advisor before making any investment or financial decisions.