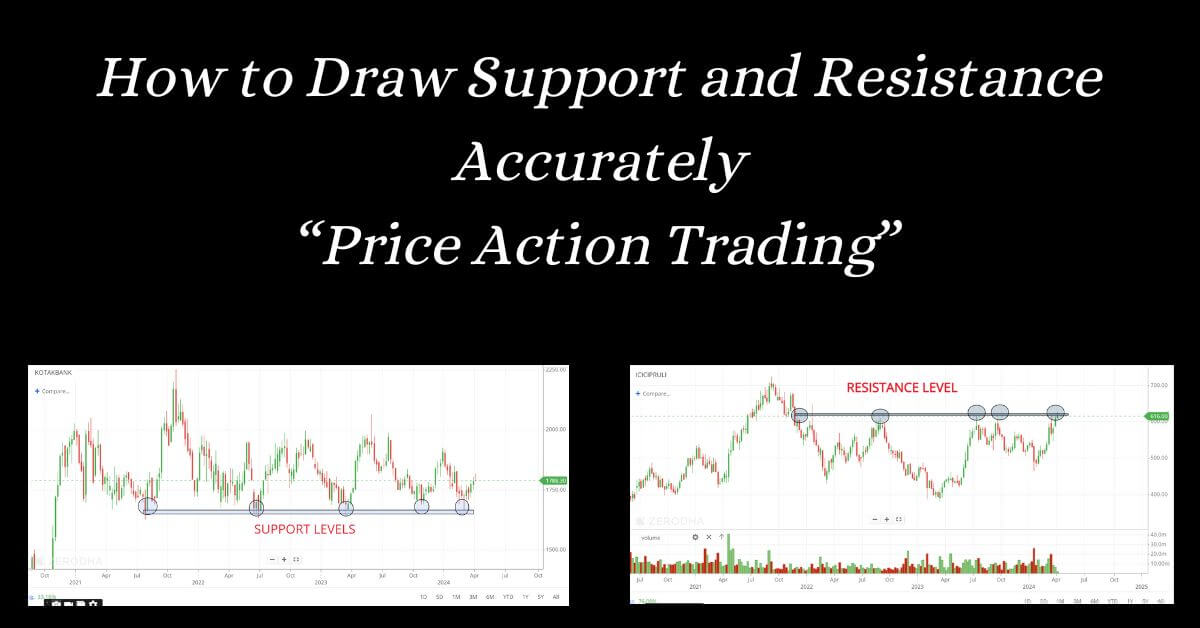
I was reading one of the best trading books, “Price Action Trading: Technical Analysis Simplified! by Sunil Gurjar.” And came up with a few quick insights related to “Support and Resistance in Stock Market.”
What Is Support and Resistance in Stock Market?
Support and resistance are technical analysis concepts. We use support and resistance in stock market to identify potential price turning points in a stock’s chart.
- Support: A price level at which the stock finds buying interest and tends to bounce back up. It’s like a floor below the current price.
- Resistance: A price level at which the stock faces selling pressure and struggles to rise further. Think of it as a ceiling above the current price.
Let’s relate support and resistance to the demand and supply zone
Support and resistance have a direct connection to the fundamental forces of demand and supply in the stock market. Here’s how they work together:
Support = Demand Zone
- A support level indicates a price zone where there’s likely to be strong buying demand. This is because past price action has shown that at this level, enough buyers step in to prevent the price from falling further.
Resistance = Supply Zone
- Resistance represents a price zone where selling pressure is high. This is because past price action suggests that at this level, sellers who bought earlier are likely to take profits or new sellers emerge fearing the stock is overvalued.
Also Check: What are the 5 Best Indicators for Intraday Trading in TradingView Free?
Read More: Shooting Star Candlestick Pattern – 1 Pattern, 3 Secrets to Find and Use
Types of Support and Resistance In Stock Market
Broadly, we can classify support and resistance into two types:
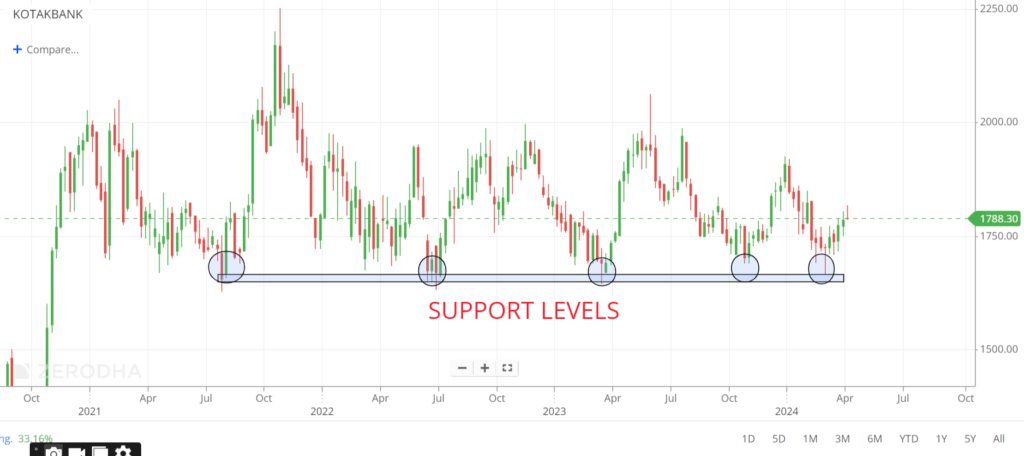
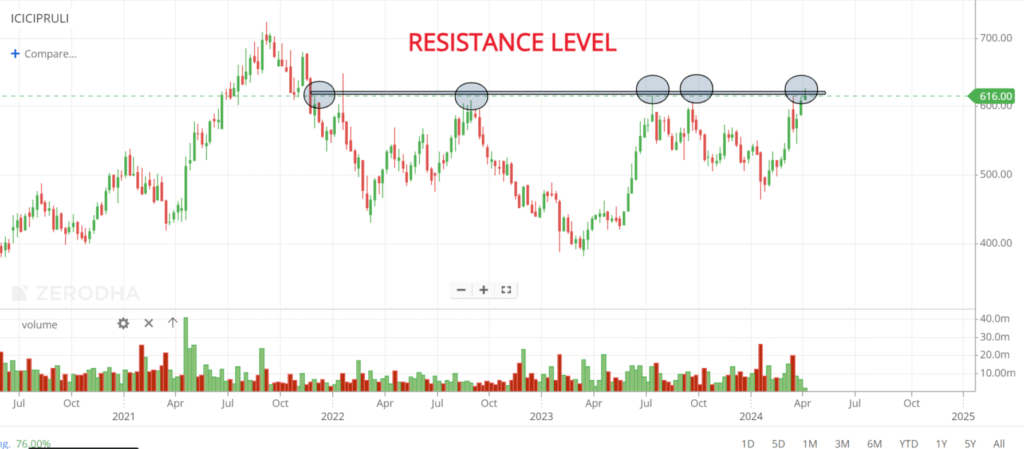
1. Static Support and Resistance
These are fixed levels on the chart. We simply draw horizontal lines to create support and resistance. They represent price points where historical buying or selling pressure has been consistent.
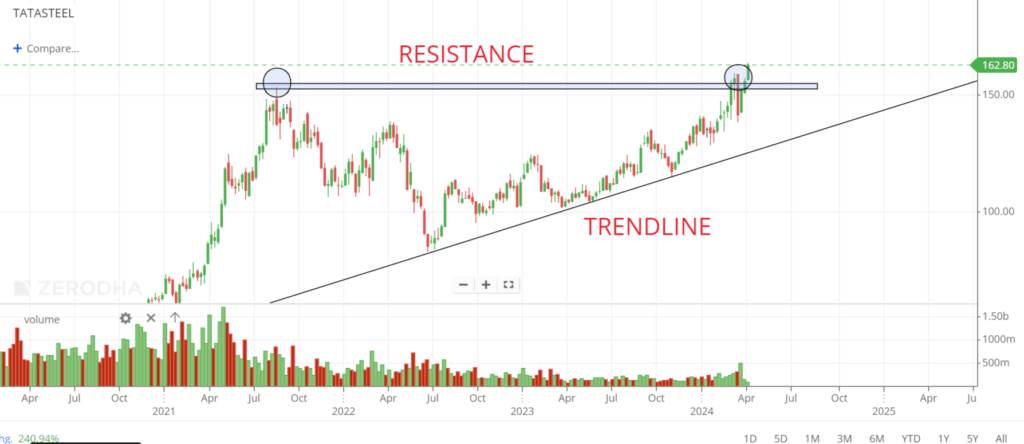
2. Dynamic Support and Resistance
When we add Moving averages and trendlines, then it is called dynamic support and resistance. These levels change as the price action reflects. They are more flexible and adapt to the evolving market sentiment.
- Moving Averages: Moving averages indicate the average price over a chosen period. Prices often tend to find support or resistance around the moving average line. (Here is a general recommendation for moving average that traders commonly use)
| 200-Day Moving Average | long-term trends |
| 100-Day Moving Average | Medium-term trends |
| 20 or 50 days Moving Average | Short-term trends |
- Trendlines: Trendlines connect highs (resistance) or lows (support) to represent an underlying uptrend or downtrend. The trendline itself acts as dynamic support (uptrend) or resistance (downtrend) as the price moves along the trend.
Which one Should You Choose?
- Static support and resistance are helpful for identifying historical turning points, but they may not adapt to changing market conditions.
- Dynamic support and resistance are more adaptable to the current market sentiment.
Now, as you have understood what is support and resistance in stock market? Let’s move practically further, how do we find support and resistance levels?
How To Find Support and Resistance Levels?
Here are the 4 quick steps to find support and resistance levels in stock market:
Plot Support Levels

Step 1: Look at the historical price data
Step 2: Identify extreme lows
Step 3: Mark all the low touch points
Step 4: Connect all the touch points
Plot Resistance Levels

Step 1: Look at the historical price data
Step 2: Identify extreme highs
Step 3: Mark all the high touch points
Step 4: Connect all the touch points
Note: you can easily draw S&R levels by logging into your demat account and opening the chart or at Tradingview.
Also Check: The Ultimate TradingView Paper Trading Tutorial 2024: Trade Your Way to Confidence
How To Draw Support and Resistance Lines?
For Support Level: Look for areas where the price has bounced back up after touching a low. Draw a horizontal line across those lows – that’s your support level.
For Resistance Level: Identify areas where the price has struggled to break through and reversed downward. Draw a horizontal line across those highs – that’s your resistance level.
(check step 3 of above for both support and resistance)
Support and Resistance for Indexes
Whether you are finding and drawing support and resistance for securities, indexes, gold, or crude oil, the process remains the same. You just need to open that particular chart and follow the above 4 steps.
Bank Nifty Support and Resistance
The Bank Nifty support and resistance refer to specific price levels in the Bank Nifty index that may indicate potential turning points.
- Support: A price level where the Bank Nifty might find buying interest, potentially causing the price to bounce back up.
- Resistance: A price level where the Bank Nifty might face selling pressure, potentially halting a price increase or even causing a reversal.
Nifty Support and Resistance
Nifty support and resistance refer to specific price levels in the Nifty 50 index that may indicate potential turning points in the market. Just like with Bank Nifty, it’s about understanding where the price might face buying or selling pressure.
- Support: A price level where the Nifty might find buying interest, where we can get a push to the Nifty. potentially causing the price to bounce back up.
- Resistance: A price level where the Nifty might face selling pressure, potentially causing a reversal.
Conclusion
In conclusion, support and resistance are valuable concepts in technical analysis that help identify potential turning points in a stock’s price movement. They represent areas on the chart where historical price action suggests a concentration of buying or selling interest.