35 Powerful Candlestick Patterns Free Book
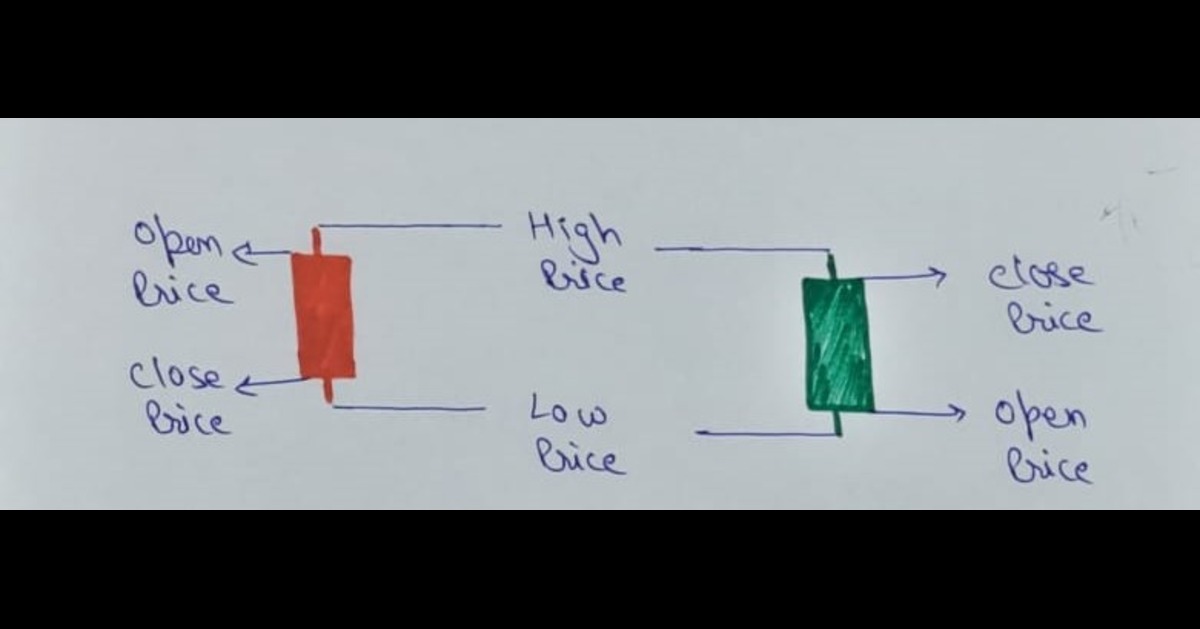
What are Candlesticks? Candlestick charts are a type of chart that uses candles to track the price movements of a security over time. Each candle represents a single trading period, and the length of the candle indicates the range of prices traded during that period. 35 Powerful Candlestick Patterns Overview File Information Details File Name … Read more


