Imagine a shooting star: it streaks high, then fades quickly. The Shooting Star Candlestick Pattern in trading works exactly like that.
But how it is related to technical analysis in the stock market?
Well, it indicates a bearish signal, appearing after an uptrend. Let’s discuss this in detail.
What is Shooting Star Candlestick Pattern?
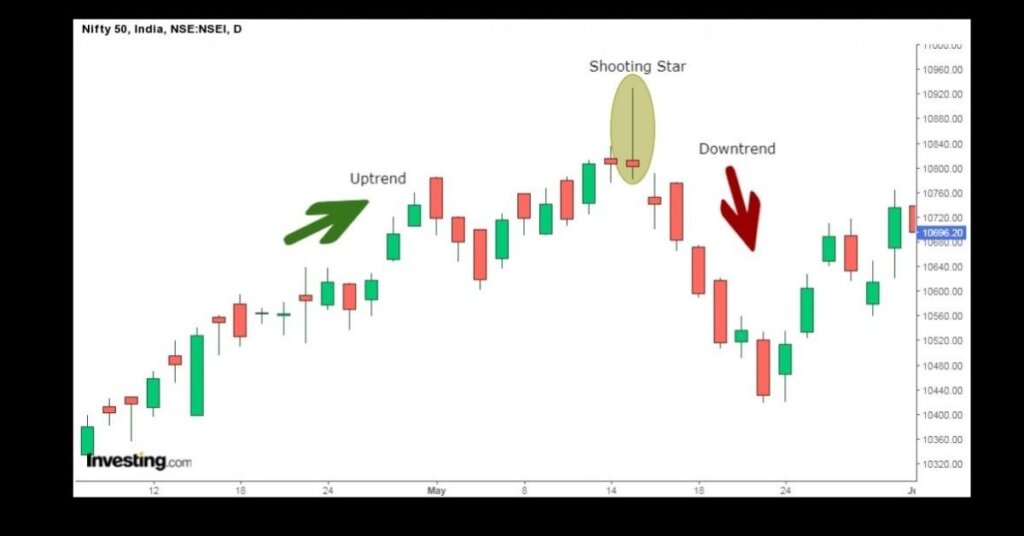
The Shooting Star Candlestick Pattern is a bearish reversal pattern. It usually occurs at the end of an uptrend.
Characteristics of Shooting Star Candlestick Pattern
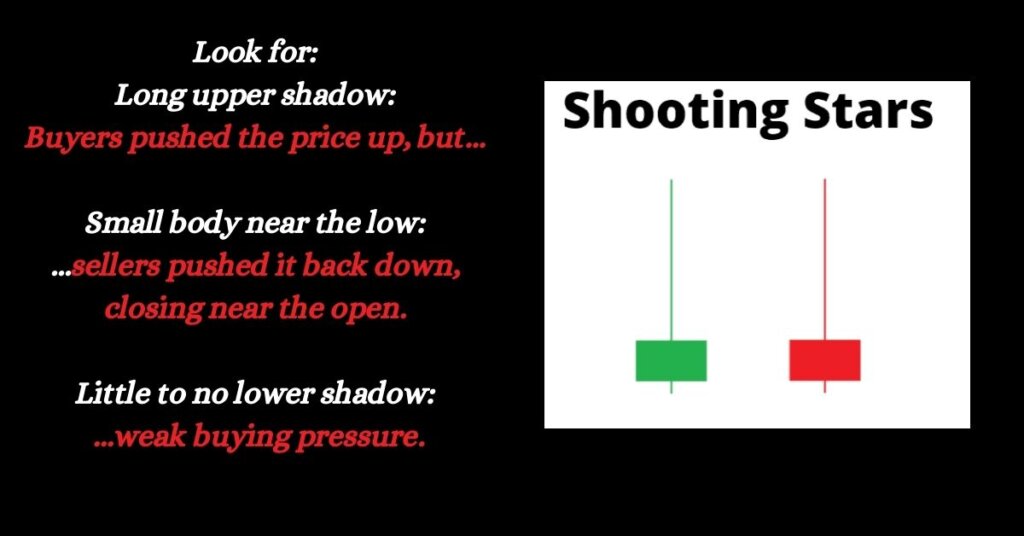
It has:
Long upper shadow: The long upper shadow signifies that the price was rejected at the high of the day. The upper shadow should be at least twice the length of the real body.
A small real body: The small real body and lack of a lower shadow means that there is a selling pressure in the market that pushed the price back down near the opening price. The real body should be near the low of the day.
A little or no lower shadow: The lower shadow should be very short or non-existent.
Formation of a Shooting Star Candlestick
Trading Example with Shooting Star Candlestick
What does a Shooting Star Pattern Indicate?
The Shooting Star Candlestick Pattern indicates a warning sign that the uptrend may be coming to an end.
Here are some additional things to keep in mind about the Shooting Star Candlestick Pattern:
- The pattern is more significant if it occurs after a strong uptrend.
- The pattern is less significant if it occurs during a consolidation period.
- The pattern is more likely to be confirmed if it is followed by a downward price movement.
Also Check: How To Make Money Trading With Candlestick Charts | Updated 2024
Also Check: 35 Powerful Candlestick Patterns
How to Use Shooting Star Candlestick Pattern?
This pattern signals a potential downturn in an uptrend. Here’s how you might use it:
Identify the pattern: Look for candlesticks with a long upper shadow, a small real body near the low, and little to no lower shadow.
Consider the market pattern: The pattern is stronger after a strong uptrend and weaker during consolidation.
Look for the confirmation: Look for additional bearish indicators like downward price movement or increased selling volume.
How to Find Shooting Star Candlestick Pattern Using Screener
Recently, I have started using StockEdge Screener to find the candlestick patterns. Here is the step-by-step guidance on how you can also find the stocks making Shooting Star Candlestick Pattern in Stock Market.
Step 1: Go to the “Candlestick Scans” and click on the drop-down to find “Bearish Reversal Scan”
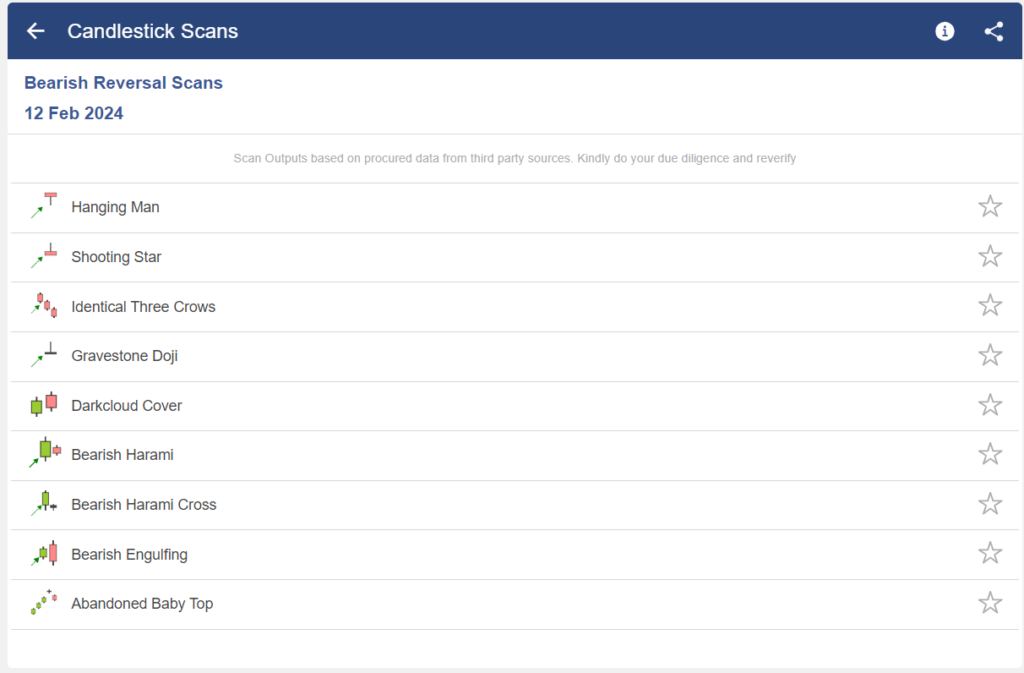
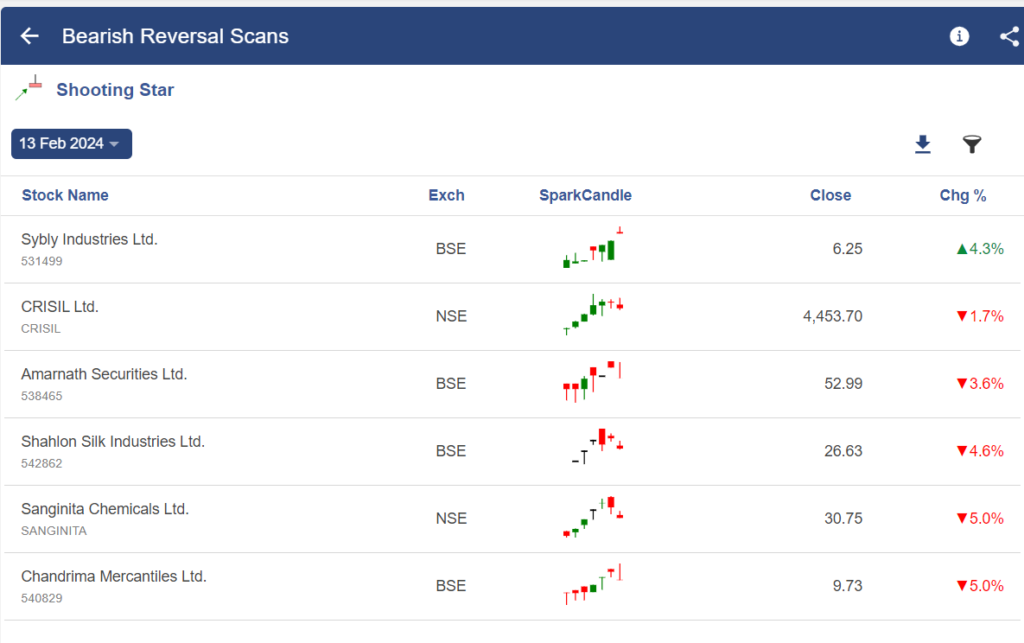
Step 2: Here you can see the “Shooting Star” scan, click on that option.
Step 3: Once you selected, you can see a list of stocks forming a “Shooting Star candlestick pattern.”
Additionally, use can also other screeners, like https://trendlyne.com/, https://chartink.com/, https://in.tradingview.com/
Difference Between Shooting Star and Inverted Hammer
| Basis of Differences | Shooting Star | Inverted Hammer |
| Pattern Type | Bearish reversal pattern: Indicates a potential downturn after an uptrend. | Bullish reversal pattern: Indicates a potential upturn after a downtrend. |
| Appearance | Long upper shadow (at least twice the real body) suggesting rejection at the high. Small real body near the low. Little or no lower shadow indicating selling pressure pushing price down. | Long lower shadow (at least twice the real body) suggesting buying pressure at the low. Small real body near the high. Little or no upper shadow indicating buying momentum. |
| Context | Shooting Star appears at the end of an uptrend. | Inverted Hammer appears at the end of a downtrend. |
| Trading implication | Shooting Star suggests a potential sell | Hammer suggests a potential buy |
Benefits of Using Shooting Star Candlestick Pattern
Simple to identify: Compared to other candlestick patterns, the Shooting Star has a relatively straightforward visual identification due to its long upper shadow, small body, and minimal lower shadow.
Potential trend reversal signal: When appearing at the end of an uptrend, the Shooting Star can warn of a possible decline, allowing traders to adjust their positions accordingly.
Confirmation opportunities: The pattern’s strength often increases when formed near resistance levels or followed by downward price movement, providing additional confirmation for bearish sentiment.
Psychological indicator: Some traders believe the pattern reflects the psychology of the market, where initial buying enthusiasm fades during the session, leaving selling pressure to dominate.
Limitations of Using Shooting Star Candlestick Pattern
False signals: Like any technical indicator, the Shooting Star can generate false signals, leading to incorrect trading decisions. Confirmation indicators and proper risk management are vital.
Subjectivity in interpretation: Determining the exact length of shadows and real body size can be subjective, leading to inconsistent interpretations among traders.
Market context matters: The pattern’s reliability depends on the broader market context, trend strength, and surrounding technical indicators.
Not a standalone tool: The Shooting Star should be used in conjunction with other technical analysis tools and fundamental analysis for comprehensive decision-making.
Conclusion
Hope, you get all your answers related to the Shooting Star candlestick pattern, like what is Shooting Star candlestick, how to use the Shooting Star candlestick in technical analysis, and how to find stocks.
However, it is important to note that no single candlestick pattern is perfect, and the Shooting Star should not be used as the sole basis for making trading decisions. Other technical indicators and confirmation signals should also be considered.
Frequently Asked Questions
Are shooting star candlesticks bullish?
No, Shooting Star candlesticks are bearish reversal patterns. They show a potential downturn after an uptrend in the market. An inverted hammer (a reversed Shooting Star) is a bullish reversal pattern that is a potential uptrend after a downtrend.
Can a shooting star candle be green?
Yes, a shooting star candle can be of any color. Green or red. This is because the pattern focuses on the shape and relative size of the shadows and body.
Are there any online tools or screeners that can identify Shooting Star patterns?
You can use Online Screeners like Trendlyne, Chartink, Screener.in (custom filters), and stockedge to find the shooting star patterns.
Is the Shooting Star a bullish or bearish pattern?
A shooting star is a Bearish pattern. It signals a potential downturn after an uptrend. It works like after an initial price rise (upper shadow), selling pressure pushes the price back down near the opening price (small body) indicating a possible reversal.
What does the Shooting Star pattern tell you about the market?
The Shooting Star pattern tells you that buying momentum might be weakening. While buyers initially pushed the price up, sellers regained control, closing near the opening price. This could signal a potential decline in the near future.
When is the Shooting Star pattern most reliable?
Shooting star pattern is more reliable when:
Seen after a strong uptrend: Indicates possible exhaustion of buying pressure.
Followed by downward price movement: Confirms the bearish signal.
Near resistance levels: Prices might struggle to break through, leading to a reversal.
What is the Shooting Star Candlestick Pattern?
A shooting star is a single candlestick with:
Long upper shadow: At least twice the length of the real body, representing the initial price rise.
Small real body: Near the low of the day, showing the closing price close to the opening.
Little to no lower shadow: Indicating minimal buying pressure after the initial push.
How can I identify the Shooting Star pattern on a chart?
Look for the characteristic features of a shooting star like long upper shadow, small real body, and little or no lower shadow on your price chart. You can also take the help of online stock screeners and trading platforms that automatically identify candlestick patterns.
How can I differentiate between a Shooting Star and an Inverted Hammer pattern?
A Shooting Star and an Inverted Hammer pattern are just opposite to each other. Shooting Star is a Bearish, long upper shadow, small body near low, whereas Inverted Hammer is a Bullish, long lower shadow, small body near high.